
Observability as Capacity Planning: How SBS Held 1.5 Million Concurrent Streams
The broadcaster’s World Cup numbers are striking and vendor-reported. The transferable lesson is forecasting demand and load-testing at projected volume instead of overprovisioning.
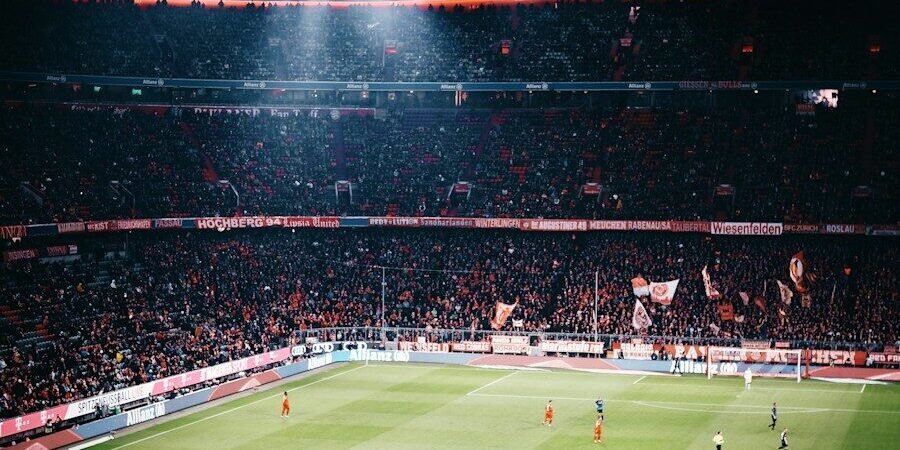
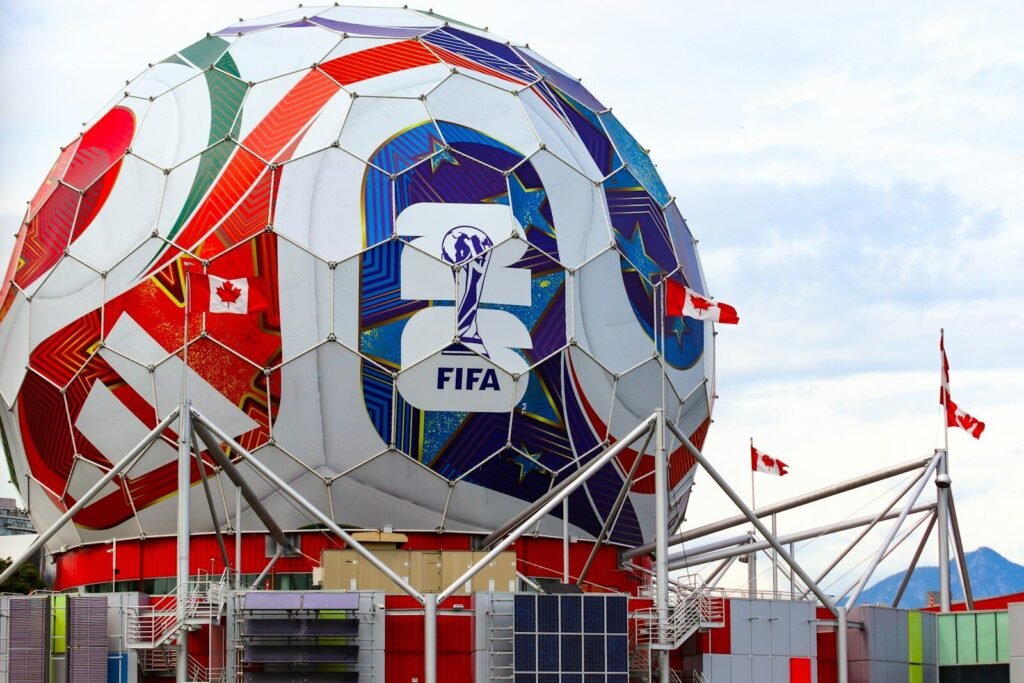
New Relic published a customer case study with numbers worth reading twice. Australia’s Special Broadcasting Service delivered 146 million streams during this year’s FIFA World Cup, up 155 per cent on 2022, with concurrent streaming peaking at 1.5 million viewers during the final. Across 104 live matches, 40 more than last time, the broadcaster reports no major technical issues, and says it reached 64 per cent of the Australian population, about 18 million people, across broadcast and digital.
Two things make that interesting. The first is that live sport is the hardest capacity problem in streaming, because demand can multiply in the minutes before kick-off and the audience does not come back if the stream fails. The second is that the figures are vendor-reported, and the comparison to 2022 flatters the growth, because the tournament itself was 63 per cent larger. Neither fact makes the result less impressive; both make it harder to read at a glance.
The numbers, and the comparison problem
The 155 per cent stream increase deserves context. SBS carried 104 matches this year against 64 in 2022, so part of the growth is simply more football. New Relic’s own published case study from the 2022 tournament records 28 million hours streamed, 800,000 sign-ups to SBS On Demand, and online audiences of up to 475,000 for that final. This year’s peak of 1.5 million concurrent viewers is therefore roughly three times the 2022 final audience on a match count up by 63 per cent, which is a real step change rather than an artefact. The release does not make that calculation, and it is the one a reader needs before repeating the figure to anyone else.
The population figure is worth translating. Sixty-four per cent of Australians is not a streaming statistic, because it counts broadcast and digital together, and free-to-air television still carries a large share of a World Cup audience in Australia. The digital figure that matters is peak concurrency, and 1.5 million simultaneous streams on a public broadcaster’s platform is the number an engineer would test against.
What SBS actually did
Live sport differs from ordinary traffic in three ways that make it a genuine test. The load is predictable in time but extreme in peak, because everyone arrives within the same few minutes. It is unforgiving, because a viewer who sees a buffering wheel during a goal does not return for the next match. And it is unrepeatable, since there is no second chance to serve the final. Those properties make capacity planning a forecasting problem rather than a scaling problem, which is why the load-testing step matters more than the dashboard.
The operational detail is the part worth borrowing. SBS runs a hybrid estate of internally built systems and third-party services, so every part of the delivery chain has to scale in step, and a fault in one component can present as a failure somewhere else entirely. Ahead of the tournament the engineering team built a single dashboard in New Relic covering 15 service components and more than 90 metrics, replacing what the company describes as a fragmented view of critical services.
Expected Audience Growth
More useful is what they did before that. Data analysts modelled expected audience growth to identify which matches would drive peak demand, and the team scaled with headroom for those matches rather than provisioning for the whole tournament at peak. They then ran load tests at projected volumes and used the monitoring to check throughput and latency across the stack, fixing constraints before the event. That sequence, forecast then load-test then instrument, is the discipline the case study is really about, and it is the opposite of the usual approach, which is to buy capacity and hope.
Broadcast streaming failures are common enough at major events that the absence of one is worth noting, and worth not overstating. Outages at high-profile sporting events have become a recurring genre of industry post-mortem, usually traced to a capacity decision made weeks earlier, an authentication service that could not scale, or a CDN configuration that behaved differently under concurrency. SBS’s approach addresses each of those: forecast the peak, test at it, and instrument every component so a fault surfaces at the component rather than at the viewer. That is why the sequence matters more than the tooling, and why the case study would be useful even if it named no vendor at all.
The consolidation economics
The dashboard matters for a second reason, which the release mentions only in passing. New Relic’s own 2025 Observability Forecast, drawn from 1,700 practitioners, found the average organisation running 4.4 observability tools, down 27 per cent over two years from six, with 52 per cent planning to consolidate further in the next year or two. A CNCF survey in May 2026 found 46.7 per cent still running two to three tools in parallel and only 7.4 per cent claiming a single unified observability experience, with 63 per cent open to switching vendors. Fifteen components and ninety metrics on one pane of glass is the sales pitch that answers that, and it is why the case study exists.
The cost argument attached to it is the strongest number in New Relic’s survey. Organisations with full-stack observability put the median cost of a high-impact outage at one million dollars an hour, half the two million their less-instrumented peers absorb. That is the commercial case for the category, and it explains why consolidation is happening even as telemetry volumes rise. The category’s structural shift matters too. OpenTelemetry, the open standard for telemetry collection, was in production use at 49 per cent of organisations in a 2025 CNCF survey, with Prometheus at 77 per cent. A standard that makes instrumentation portable lowers the cost of switching and pushes vendors to differentiate on analysis rather than ingestion. That is the ground the unified-dashboard pitch stands on, and it is why the pitch keeps needing customer names attached.
New Relic’s position
Read commercially, the announcement is a reference win, and reference wins matter more for New Relic than for most vendors because the company no longer publishes financials. Francisco Partners and TPG took it private in November 2023 at 87 dollars a share, roughly 6.5 billion dollars in equity value, and it has disclosed nothing since. Its last public year posted about 926 million dollars of revenue growing 18 per cent, and pre-buyout estimates put it near 970 million at around 7 per cent growth.
Set that against the competitors it now fights. Datadog reported 3.43 billion dollars for 2025, up 28 per cent, then posted its first billion-dollar quarter in the first three months of 2026 with revenue up 32 per cent and raised guidance for the year. Dynatrace carries 2.05 billion dollars of annual recurring revenue growing 18 per cent. A vendor growing at high single digits, owned by private equity, competing against one compounding above 30 per cent, needs exactly this kind of proof: a named broadcaster, an unusually demanding event, and numbers a buyer can repeat to a board. The 2030 rights extension, announced alongside, extends the reference’s shelf life by four years.
What the release does not say
Four things are missing. There is no incident count, so zero major technical issues is a characterisation rather than a measurement, and the definition of major goes unstated. There is no cost figure, which matters in a category where buyers now worry about consumption pricing, and New Relic’s model has drawn complaints about year-end sticker shock since before the buyout. Above all, there is no architecture detail: which components, which third-party services, what the dashboard actually showed. And there is no independent verification, since the trade publications that covered the announcement reproduced the release.
What to watch
Three markers will show whether this becomes a repeatable play. The first is the 2030 tournament, because a reference that holds across two cycles is worth more than one that holds across one, and SBS has already committed. The second is whether New Relic publishes a comparable case study from a different vertical, since a single media reference proves the product can work rather than that it generalises. The third is the consolidation thesis itself: if the 52 per cent who plan to cut tools actually do it, the winners will be platforms with the widest surface, and the case study is an argument that New Relic is one. That argument will settle in procurement decisions rather than in reference stories.
What it signals
The announcement marks the point where observability sells itself as capacity planning rather than troubleshooting. The pitch used to be that you find out what broke; the pitch now is that you forecast demand, test at volume, and never buy the capacity you do not need. That is a better argument, because it attaches to a budget line rather than an incident, and it is also harder to disprove, because the savings from infrastructure you did not provision never appear in a report. Buyers should treat it as a discipline worth adopting and a claim worth measuring, which is roughly what SBS did with the tournament itself. The measure to watch is not whether the dashboard existed but whether the broadcaster provisions less infrastructure next time.