
Cloudflare’s Q3 Data Shows DDoS Attacks Got Smaller, Faster and 208% More Numerous
Hyper-volumetric attacks fell by nearly 70 per cent while total volume more than tripled. The report’s own framing is the accurate one: more swarms, fewer giants.
Cloudflare mitigated 18.2 million network-layer DDoS attacks in the third quarter of 2026, an average of 8,226 every hour, or roughly one every 0.44 seconds. That is a 208 per cent increase on the same quarter last year. The striking finding is what did not grow. Attacks exceeding 1 Tbps fell to 251 from 805 in the second quarter, a drop of nearly 69 per cent. The company’s own title for the quarter is the accurate summary: more swarms, fewer giants.
The numbers
The report is the 26th in the series and the first quarterly edition after a combined first-half volume, covering July to September. Alongside the 18.2 million network-layer DDoS attacks it counts 14.4 trillion HTTP DDoS requests. Mitigated traffic totalled 272.6 petabytes at the network layer and 95.1 at the HTTP layer.
The distribution matters more than the totals. Ninety-six per cent of attacks ended within ten minutes, and 98 per cent stayed below 1 Gbps. That combination is the operational signature of a booter, the rentable attack service that sells short bursts to anyone with a grievance and a payment method. A gigabit is not much bandwidth, but it is more than enough to take a single server or a small site offline for the few minutes before anyone notices.
The HTTP layer deserves its own line, because it is where the report is least analytical. Cloudflare counted 14.4 trillion HTTP DDoS requests against 95.1 petabytes of mitigated HTTP traffic, and offers no year-on-year comparison for either. The network-layer figures carry the report’s argument; the application-layer figures appear without interpretation. That is a gap rather than an error, and it matters because layer-seven DDoS attacks are the kind most small organisations actually experience.
Cloudforce One, the company’s threat intelligence organisation, produces the analysis. Its vantage point is both the report’s strength and its limit. It describes attacks against Cloudflare’s customers and the traffic the network absorbs, which is a large and representative sample but not a census of the internet. An organisation outside that network appears in these figures only when an attack against it happens to traverse it.
Why the giants fell
Hyper-volumetric attacks above 1 Tbps dropped by nearly 69 per cent quarter on quarter. Cloudflare attributes the shift, carefully, to law enforcement action in early 2026 that dismantled four of the largest IoT DDoS botnets: Aisuru, KimWolf, JackSkid and Mossad. The hedge is appropriate and the report makes it explicitly. A correlation across one quarter is not proof.
The ecosystem also shows what follows a takedown. New variants named Dysphoria and Evooo1Bot are filling the gap, and Mirai-classified traffic peaked in August at 57.23 petabytes, which is 46.5 per cent of all mitigated network-layer bytes in the quarter. Four days in August each cleared three petabytes, and the longest sustained Mirai attack ran 49.7 hours between 19 and 21 August.
That is the necessary qualification to the headline. The giants became rarer without the underlying capability disappearing. A botnet family that can sustain an attack for two days has not gone away because its largest siblings were seized, and the replacement variants are already carrying volume. The booter market is where the quarter’s economics become visible. A booter sells access to a panel that launches attacks on request, usually for a subscription measured in tens of dollars a month, and its customers are individuals rather than organisations: someone angry at a game server, a competitor, a former employer.
The service is not sophisticated and does not need to be. At 1 Gbps for eight minutes, an attacker needs enough volume to overwhelm one target and enough brevity to finish before mitigation or a hosting provider’s abuse desk responds. In that model the marginal DDoS attack costs almost nothing to produce, which is why the count can triple while aggregate bandwidth falls.
The vector whiplash
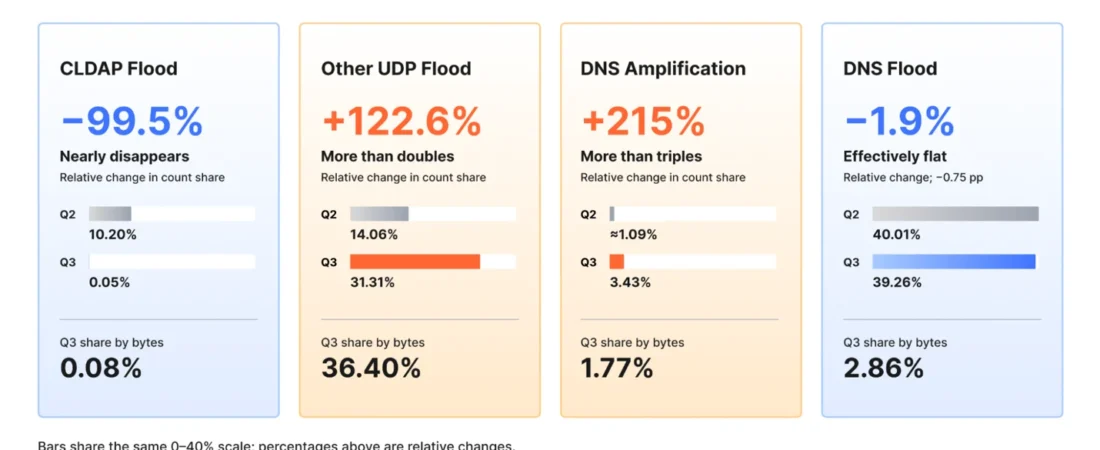
The most dramatic change of the quarter was downward. CLDAP floods exploit public domain controllers on UDP port 389 by sending small queries with a forged victim address and receiving large amplified replies. They had surged 580 per cent quarter on quarter in the first half of the year. In the third quarter they collapsed 99.5 per cent to 0.05 per cent of attacks.
Attackers moved rather than stopped. DNS amplification rose 215 per cent to 3.43 per cent of network-layer attacks, exploiting open resolvers in the same reflection pattern. General UDP floods climbed from 14.06 to 31.31 per cent. The mechanics are simple: UDP is connectionless, so a target must check for a listening application and respond, consuming network and compute whether or not the packet was ever legitimate.
The CLDAP collapse is the more interesting figure because it suggests something got fixed. A vector does not fall by 99.5 per cent because attackers lost interest. It falls because the exposed infrastructure it depended on was closed, or because filtering became cheap enough to make the vector unprofitable. Either explanation is good news for defenders, and neither is permanent.
Where the attacks went
The United States reclaimed the most-attacked position from China, with China second and Indonesia entering the top three at 2.93 per cent of attacks. The two leaders have traded places through the year as attacker attention shifted rather than as their infrastructure changed. Indonesia entering the top three is a new entry and the report does not explain it, which is worth noting because a top-three position usually prompts an explanation. The remaining positions follow the established pattern of large internet populations and dense hosting infrastructure. What has changed is not which countries attract the most attacks in absolute terms but how quickly the ranking responds to events.
Two countries moved sharply. Canada jumped from 16th to sixth during a period of bilateral trade disputes, with attacks concentrated on retail, telecommunications, service providers and carriers, and marketing and advertising. Israel climbed seven places to tenth after sustained activity in mid-September, a period that included contentious decisions ahead of parliamentary elections and the Rosh Hashanah holiday, alongside a documented broader surge in hostile cyber activity against the country this year.
Neither move proves a political motive and the report does not claim one. What the data shows is that national ranking in DDoS telemetry tracks events rather than underlying capability, which is why a country can climb ten places in a quarter without anything about its networks changing at all.
The industry shift
Media, Production and Publishing remained the most-attacked industry, but its share fell to roughly a quarter of its second-quarter level. The slack went to a wider field. Internet infrastructure rose from outside the top ten to sixth, Consumer Services reached eighth and Adult Entertainment ninth. The booter-targeted sectors the report names, computer software, gambling and casinos, and information technology, fit that pattern. Short-burst DDoS attacks are cheap, so attackers aim them at whoever is easiest to disrupt rather than whoever is most strategic.
The booter business and the defender’s dilemma
The practical consequence for an organisation outside the largest networks is that the threat it faces is probably not the one the headline describes. An attack on a mid-sized business is unlikely to exceed 1 Tbps and highly likely to end within ten minutes, which makes automatic mitigation at the edge more valuable than an incident response process. The report’s numbers make that argument better than its prose does.
What defenders should take from it
Three things follow. Short attacks defeat alerting built around human response, because most of them finish before an analyst reads the notification, which is why Cloudflare argues autonomy is a requirement rather than a differentiator. The vector rotation means filtering rules tuned to CLDAP a year ago now address a vanishing fraction of traffic. And the free DDoS Botnet Threat Feed, which the company says more than 800 networks have joined, is the mechanism by which hosting providers can act against abusive addresses rather than only absorb their traffic. That feed is the one part of the report describing a defence with a feedback loop, and its adoption number is the most concrete measure of industry cooperation the document offers.

What to watch
Whether the fourth quarter reverses the hyper-volumetric decline as replacement botnets scale into the capacity the seized ones held. Whether CLDAP stays suppressed or returns through a different exposed service, since the reflection technique outlives any particular protocol. And whether the booter share keeps climbing, because a market where 96 per cent of DDoS attacks last under ten minutes is a market where the cost of an attack has fallen close to nothing. That is a harder problem than any single large attack, and the quarter’s real finding is economic rather than technical: attacks became cheaper to launch and less rewarding to launch at scale, so the market moved downmarket.
Cloudflare‘s interest in publishing this data is straightforward, since a quarterly report of this kind is the most effective marketing a mitigation business can produce: it demonstrates that the threat is large, growing and beyond unaided human response. That does not make the figures wrong. It does mean the framing deserves the same scrutiny as the numbers, and in this case the framing, more swarms and fewer giants, happens to be the accurate one.